Chart Annotations
Annotations let you pin a note to a specific moment on a chart. Use them to mark deployments, incidents, configuration changes, maintenance windows, or anything else that explains what you see in the data. Everyone in your Space who can open dashboards sees the same annotations, so the context travels with the chart.
Annotations are a Netdata Cloud feature. They are stored in your Space and are not available on Agent dashboards that are not connected to Netdata Cloud. Only Space Admins can create, edit, or delete annotations. Managers, Troubleshooters, and Observers see them read-only. The Billing role has no dashboard access and does not see them. See Role-Based Access.
Add an Annotation
- With the default Pan tool selected, click anywhere on a line, area, or stacked chart at the moment you want to annotate. A dashed grey marker appears at that timestamp, together with a New annotation box showing the selected date and time.
- Click the + button in the box to open the annotation form.
- Type your note and pick a priority by clicking one of the color swatches (see below).
- Press Enter or click the check mark to save. Press Escape or click X to discard.
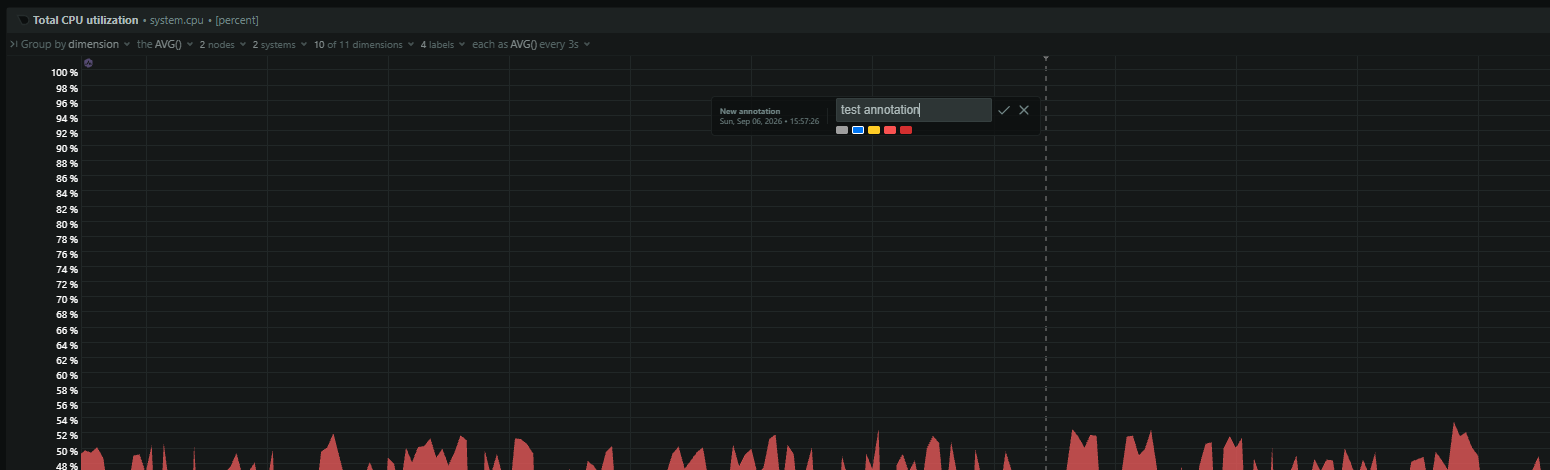
The saved annotation is drawn as a solid vertical line in the priority color, with a small dot at the top of the chart.
Clicking a chart also locks playback at that point in time, as described in Play, Pause, and Reset Controls. If you clicked by accident, use the X in the New annotation box to dismiss the draft.
Priorities
Each annotation has a priority that sets its color on the chart:
| Priority | Color | Typical use |
|---|---|---|
| Debug | Grey | Low-signal notes, experiments |
| Info | Blue | Deployments, config changes (default) |
| Warning | Yellow | Something to keep an eye on |
| Error | Red | A failure or incident |
| Critical | Dark red | A major outage or data-loss event |
View an Annotation
Hover the mouse close to an annotation's vertical line. A popover shows the note text, the date and time, the priority, and an action bar. The popover stays open for a moment after you move away so you can reach its buttons.
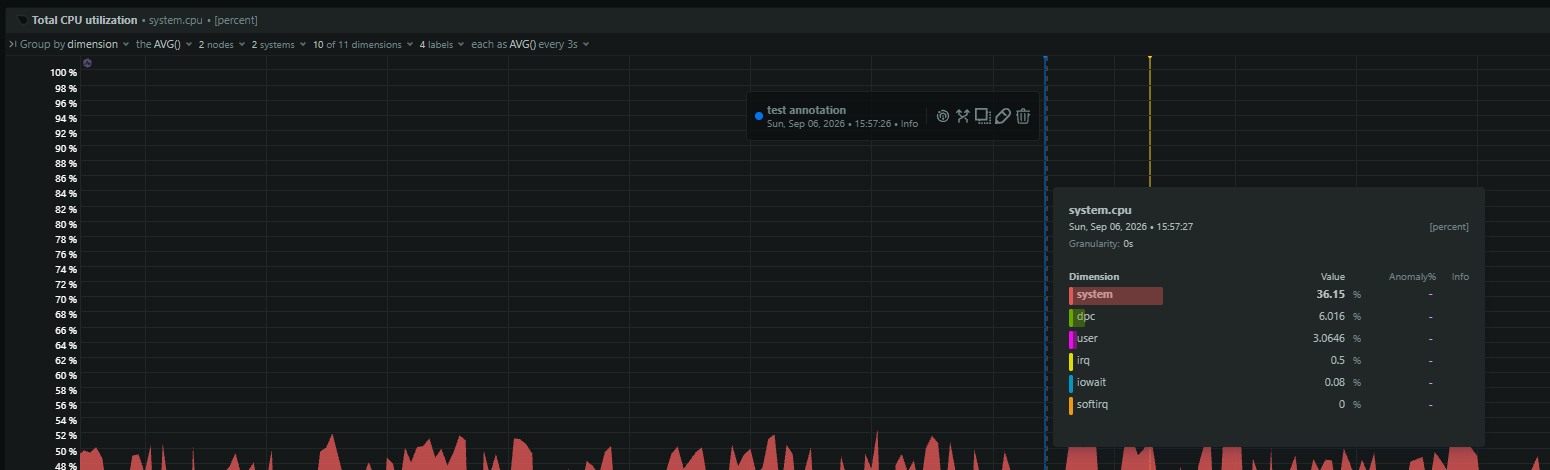
| Action | Icon | What it does |
|---|---|---|
| Sync / make global | Globe | Click once to show the annotation temporarily on all charts in view. Double-click to make it global. See below. |
| Run metrics correlation | Correlate | Runs Metric Correlations on a five-minute window centered on the annotation. |
| Copy URL | Copy | Copies the current dashboard URL, including the visible time range, so you can share the moment with others. |
| Edit | Pencil | Change the text or priority. Available to Admins. |
| Delete | Trash | Removes the annotation after you confirm. Available to Admins. |
Where an Annotation Appears
An annotation has one of three scopes.
| Scope | How to get it | Where it shows | Saved? |
|---|---|---|---|
| Chart-specific | Default when you create an annotation | On every chart of the same context, for example system.cpu, across all nodes and Rooms in the Space. | Yes |
| Global | Double-click the globe icon | On every chart in the Space. | Yes |
| Temporarily synced | Single-click the globe icon on a chart-specific annotation | As a dashed, semi-transparent copy on every other chart currently on the page. Disappears when you reload. | No |
The globe icon changes color to show the current state: blue for global, yellow for temporarily synced, grey for chart-specific.
- On a global annotation, double-click the globe to turn it back into a chart-specific one.
- On a temporarily synced annotation, click the globe once to remove the synced copies from the other charts.
- A synced copy has its own actions: Go to source chart, Run metrics correlation, Copy URL, and Remove from this chart.
Tips
- Annotate as soon as you act. A "Deployed v2.3.1" note at the exact minute saves a lot of guesswork when the on-call engineer looks at the chart a week later.
- Use Critical and Error sparingly so they stand out.
- Combine an annotation with Run metrics correlation to find which other metrics changed at the same moment.
- Use Copy URL in incident channels so teammates land on the same time range and see the same marker.
Do you have any feedback for this page? If so, you can open a new issue on our netdata/learn repository.